daime: Digital Image Analysis in Microbial Ecology


About daime
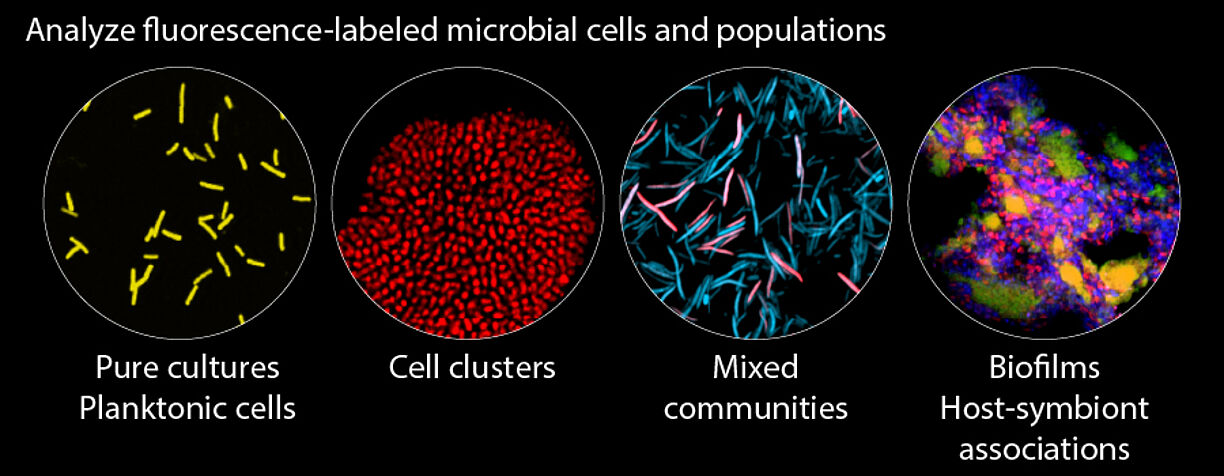
daime is a scientific image analysis and visualization software designed for microbiology, microbial ecology, and microbiome research.
It offers a comprehensive suite of tools for analyzing 2D and 3D microscopy datasets of microorganisms labeled by fluorescence in situ hybridization (FISH) or other fluorescence staining methods. daime can analyze single cells and cell aggregates across various sample types including biofilms, flocs, animal and plant tissues, and microbial enrichment cultures and isolates.
daime is free, open-source software published under the GNU General Public License (GPL).
Selected Features
- Analysis of single 2D images, batches of images, and 3D z-stacks
- Image import from manufacturer files including Leica LIF, Zeiss LSM, and many others
- Image pre-processing (background reduction, morphology, Boolean operations, etc.)
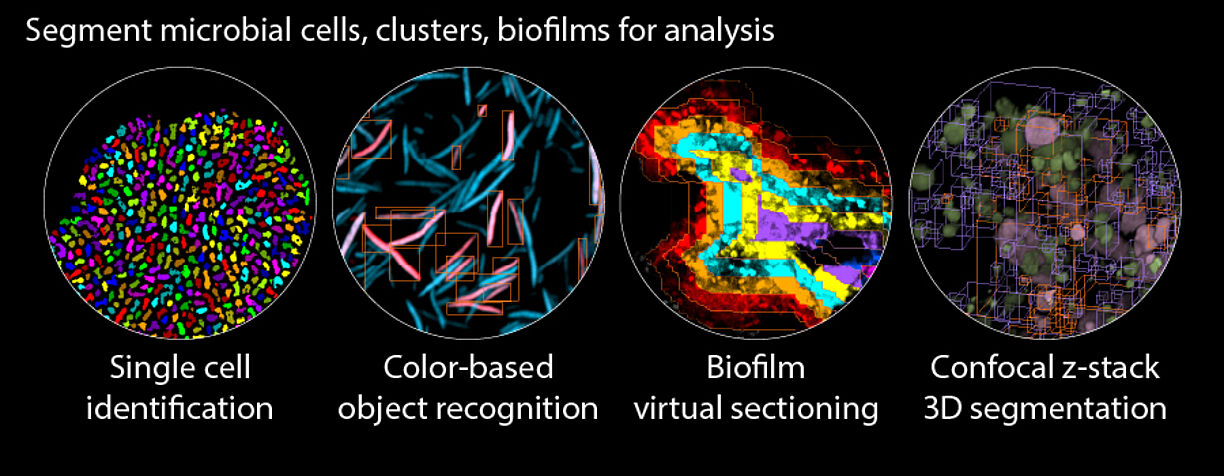
- 2D/3D image segmentation (global and local thresholding, edge detection, object splitting)
- Color-based object recognition
- Automated object classification
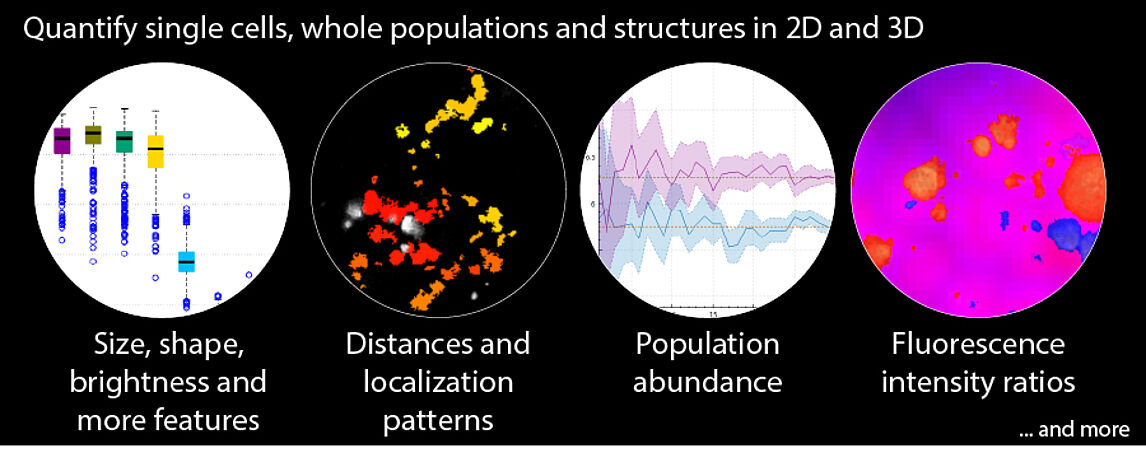
- Object feature analysis (size, shape, diameter, brightness, localization, etc.)
- Microbial abundance quantification (cell counts, biovolume fraction)
- Spatial pattern analysis across populations (coaggregation, segregation, random distribution)
- Virtual biofilm sectioning for downstream analyses
- Population and object feature analysis in user-defined spatial regions
- Melting curve analysis of rRNA-targeted FISH probes
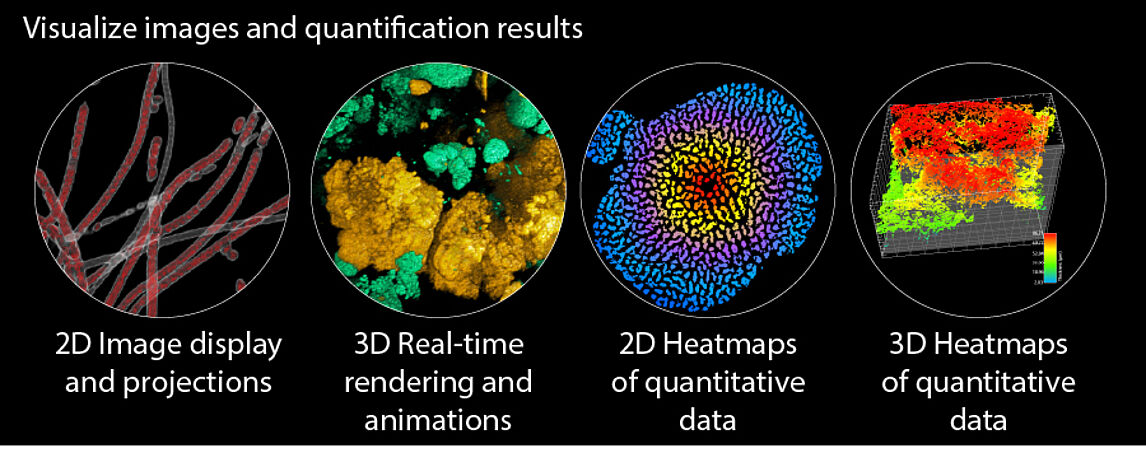
- Interactive 2D/3D visualization (real-time 3D rendering, fly-through, movie export)
- Data visualization (plotting, 2D/3D heatmaps)
- Connectivity with R (data export, automated scripting)
All functions are fully integrated and accessible through a user-friendly graphical interface. No programming skills are needed to use daime.
Widespread Use
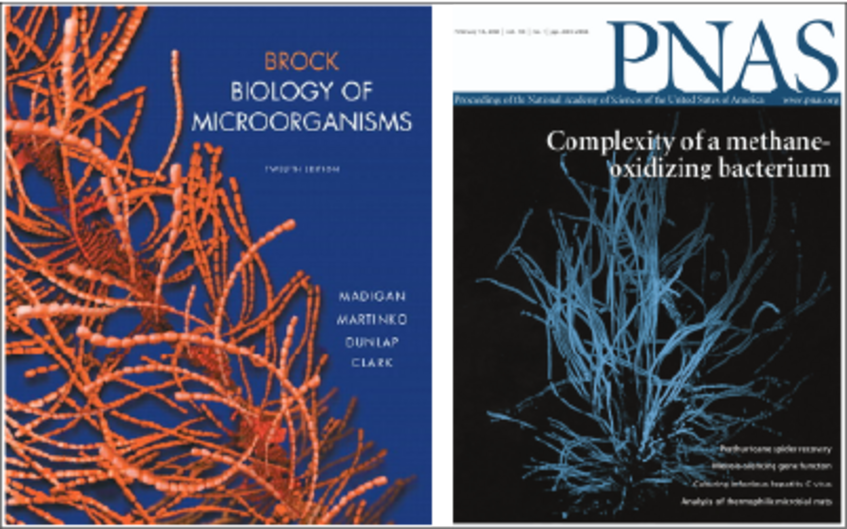
daime has been used in hundreds of studies across microbial ecology, medical microbiology, microbiome research, and environmental engineering. Its 3D visualization capabilities were used to render the cover illustrations of "Brock - Biology of Microorganisms" (12th edition) and of PNAS vol. 103(7).
daime Reference
Daims H, Lücker S, Wagner M. 2006. daime, a novel image analysis program for microbial ecology and biofilm research. Environ. Microbiol. 8: 200-213. Full text.
daime is an acronym for "digital image analysis in microbial ecology". The software is developed and coded by Holger Daims. Any similarity of the acronym with his name is pure coincidence ;-)
We kindly ask users to cite the above paper if they have used daime in a published study.
Download daime
daime is available for Microsoft Windows, Apple macOS, and Linux operating systems.
It runs natively on all supported platforms and does not require any third-party software.
We provide ready-to-use binary packages that run directly on Windows PCs, Macs, and many Linux systems. Users who prefer to compile daime themselves for a specific platform can download the source code along with detailed instructions.
Sample images and a step-by-step tutorial are provided to help new users become acquainted with the features and workflows of the software.